Research conducted by Gallup Pakistan and PRIDE, using data from the Labour Force Survey 2020-21 shows that 21.8 million youth (aged 15-29) is neither in education, nor in training and nor in employment.
Gallup Pakistan & PRIDE have joined hands to analyze and disseminate useful and policy relevant economic and social data for wider policy circles in Pakistan.
Bilal Gilani, Executive Director at Gallup Pakistan explains the collaboration ‘Pakistan does not have a dearth of data but a shortage of both usable data as well as data analysts who can unlock the vast amounts of data already collected. for past many decades, we hope to plug this issue.’
The current series of Reports would be looking at Labour Force Survey 2020-21 which is a large-scale survey conducted with close to 96,000 Pakistanis, conducted by the Pakistan Bureau of Statistics (PBS).
Key Findings:
- Analysis of data from the most recent round of Labour Force Survey for 2020-21 reveals that out of the total youth population (aged 15-29 years) of 58.6 million, 21.8 million were neither enrolled in school or a training institute nor in any type of employment (NEET). This translates into a NEET rate of 37%.
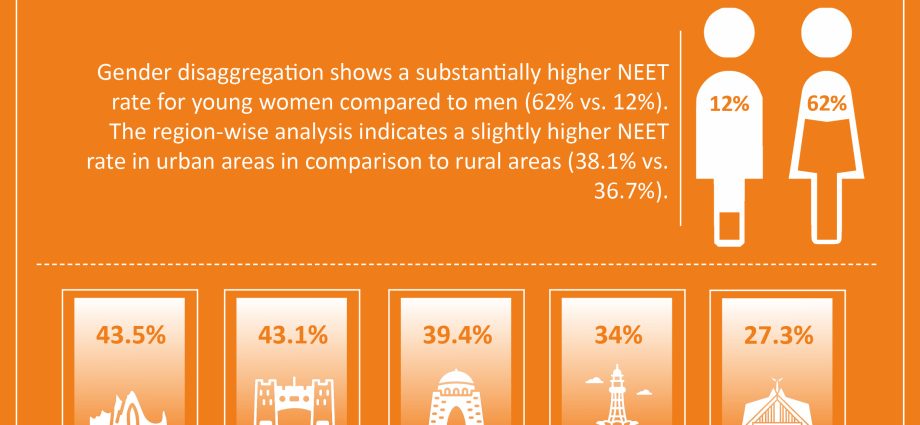
- Gender disaggregation shows a substantially higher NEET rate for young women compared to men (62% vs. 12%). The region-wise analysis indicates a slightly higher NEET rate in urban areas in comparison to rural areas (38.1% vs. 36.7%).
- The province-wise NEET rate shows that the NEET rate is highest in Balochistan at 43.5%, followed closely by KP (43.1%), while it is lowest in Punjab (34%).
- In Punjab, the NEET rate varies from 30.5% for DG Khan division to 36.9% in Gujranwala division. In Sindh, this rate is the lowest in Larkana division, at 34% and highest in Hyderabad division, at 42%. In Khyber Pakhtunkhwa, it ranges from a low of 38.6% in Hazara division to a high of 50.4% in Kohat division. In Balochistan, this rate is the lowest in Nasirabad division (30.8%) and highest in Kalat division (51.4%).
Survey:
|
Punjab
|
Sindh
|
KP
|
Balochistan
|
ICT
|
Pakistan
|
|
|
Overall
|
31.6
|
13.2
|
9.8
|
3.4
|
0.6
|
58.6
|
|
Male
|
15.4
|
6.8
|
4.9
|
1.8
|
0.3
|
29.2
|
|
Female
|
16.2
|
6.4
|
4.9
|
1.6
|
0.3
|
29.4
|
|
Rural
|
19.6
|
6.5
|
8.2
|
2.4
|
0.3
|
36.9
|
|
Urban
|
12.1
|
6.7
|
1.6
|
1.0
|
0.3
|
21.7
|
|
Punjab
|
Sindh
|
KP
|
Balochistan
|
ICT
|
Pakistan
|
|
|
Overall
|
10.8
(34%)
|
5.2
(39.4%)
|
4.2
(43.1%)
|
1.5
(43.5%)
|
0.17
(27.3%)
|
21.8
(37.2%)
|
|
Male
|
1.9
(12.3%)
|
0.7
(10.6%)
|
0.6
(12.8%)
|
0.2
(13.8%)
|
0.04
(12.8%)
|
3.6
(12.2%)
|
|
Female
|
8.8
(54.3%)
|
4.5
(70%)
|
3.6
(72.8%)
|
1.2
(77.6%)
|
0.13
(44.7%)
|
18.2
(62.0%)
|
|
Rural
|
6.4
(32.7%)
|
2.5
(38.1%)
|
3.6
(43.5%)
|
1.0
(43%)
|
0.09
(30.4%)
|
13.5
(36.7%)
|
|
Urban
|
4.4
(36.4%)
|
2.7
(40.8%)
|
0.7
(40.7%)
|
0.4
(44.7%)
|
0.08
(24.4%)
|
8.3
(38.1%)
|
|
NEET
|
DG Khan
|
Sargodha
|
Rawalpindi
|
Sahiwal
|
Bahawalpur
|
Faisalabad
|
Multan
|
Gujranwala
|
Lahore
|
|
Overall
|
30.5
|
36.8
|
35.7
|
32.4
|
31.2
|
33.5
|
33.5
|
36.9
|
34.2
|
|
Male
|
9.6
|
14.3
|
17.9
|
7.9
|
8.3
|
11.7
|
15.2
|
15.2
|
12.2
|
|
Female
|
50.7
|
55.9
|
53.3
|
55.2
|
53.1
|
55.4
|
50.0
|
55.6
|
57.1
|
|
Rural
|
29.6
|
36.3
|
34.6
|
32.0
|
29.5
|
31.3
|
32.6
|
35.4
|
34.2
|
|
Urban
|
34.4
|
38.5
|
37.4
|
33.7
|
36.0
|
36.9
|
35.8
|
39.3
|
34.2
|
|
NEET
|
Sukkur
|
Larkana
|
Mirpurkhas
|
Shaheed Benazirabad
|
Hyderabad
|
Karachi
|
|
Overall
|
41.2
|
34.0
|
38.0
|
36.1
|
42.0
|
40.6
|
|
Male
|
11.0
|
7.4
|
9.0
|
7.6
|
10.4
|
13.5
|
|
Female
|
72.4
|
62.3
|
69.6
|
67.6
|
74.4
|
70.0
|
|
Rural
|
39.5
|
30.8
|
38.6
|
34.3
|
42.6
|
44.7
|
|
Urban
|
44.0
|
41.3
|
35.7
|
40.5
|
41.1
|
40.3
|
|
NEET
|
DI Khan
|
Bannu
|
Hazara
|
Kohat
|
Malakand
|
Mardan
|
Peshawar
|
|
Overall
|
44.4
|
41.0
|
38.6
|
50.4
|
47.2
|
39.7
|
40.4
|
|
Male
|
10.8
|
11.4
|
14.3
|
18.8
|
15.3
|
10.9
|
9.4
|
|
Female
|
85.6
|
70.0
|
61.5
|
77.2
|
79.2
|
66.4
|
71.3
|
|
Rural
|
44.5
|
41.2
|
39.5
|
50.9
|
47.5
|
38.6
|
41.3
|
|
Urban
|
44.1
|
34.8
|
30.6
|
47.2
|
45.2
|
45.4
|
38.4
|
|
NEET
|
Kalat
|
Makran
|
Nasirabad
|
Sibi
|
Zhob
|
Quetta
|
|
Overall
|
51.4
|
46.5
|
30.8
|
36.9
|
45.1
|
43.0
|
|
Male
|
16.9
|
9.9
|
10.2
|
16.2
|
13.2
|
14.6
|
|
Female
|
87.5
|
82.0
|
53.8
|
64.3
|
81.3
|
79.4
|
|
Rural
|
53.1
|
44.9
|
27.1
|
35.0
|
45.9
|
43.5
|
|
Urban
|
47.9
|
49.6
|
43.5
|
43.5
|
40.1
|
42.1
|

